Table of Contents
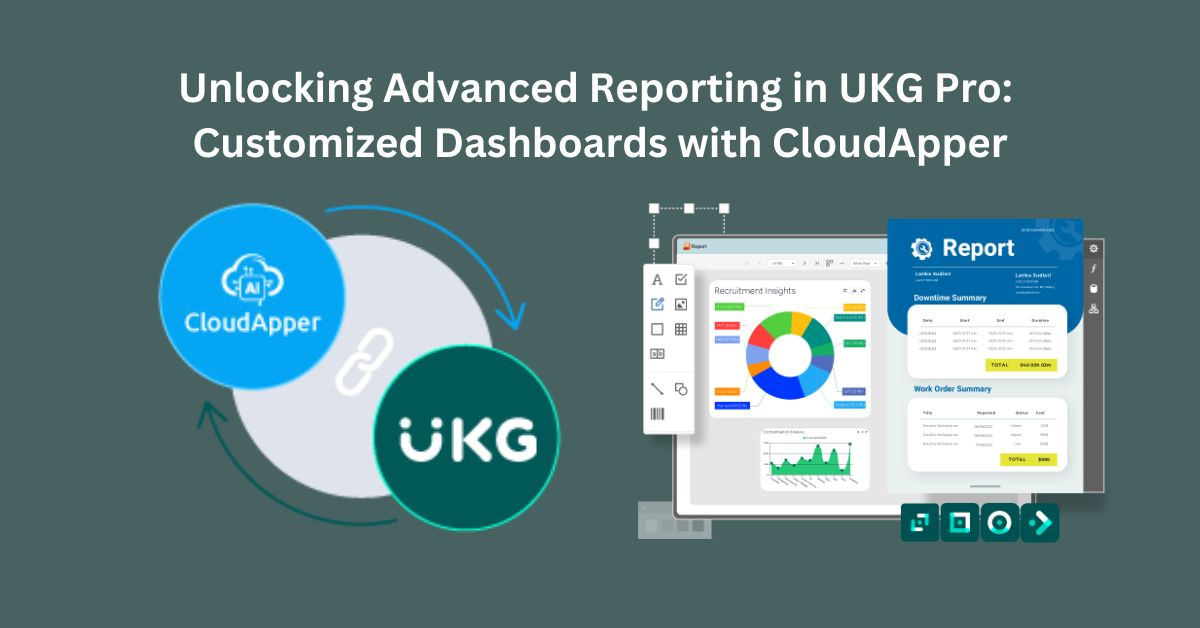
The ability to transform raw information into actionable insights is crucial for making informed decisions. However, extracting meaningful insights from complex data sets can be a daunting task. That’s where CloudApper Dashboards and Reporting come into play. With our stunning designs and personalized reports, we enable UKG users to unlock the full potential of their data, empowering them to embark on a visual journey that delivers clear and impactful insights.
Experience Data Visualization Like Never Before
Revolutionary “Story-Driven” Dashboard Designs
By seamlessly integrating captivating narratives and interactive graphics, CloudApper Dashboards bring complex data to life. These innovative designs transform data into engaging stories, enabling UKG customers to understand trends, patterns, and correlations more intuitively.
Stunning Dashboards and Customized Data Visualizations
CloudApper Dashboards offer a range of visually stunning designs that turn raw data into compelling visualizations. These interactive dashboards provide a dynamic way to explore and analyze data, helping users derive actionable insights effortlessly.
Powerful Reporting Engine
CloudApper’s powerful reporting engine enables the creation of customized reports quickly. Users can choose from various report types, including tabular reports, subreports, and charts, to effectively communicate their data insights.
Effective Data-Driven Decision-Making
By presenting data in an engaging and digestible format, CloudApper Dashboards and Reporting facilitate effective data-driven decision-making. Decision-makers can easily grasp the key metrics, identify trends, and make informed choices that drive organizational success.
Comprehensive Analytics
CloudApper Dashboards and Reporting seamlessly integrate with UKG, enabling users to access unified and comprehensive analytics. This integration ensures that users can leverage their UKG solution data to gain holistic insights and make data-backed decisions.
Web and Mobile Platforms
CloudApper Dashboards and Reports can be effortlessly deployed across web and mobile platforms. This flexibility allows users to access and explore their data anytime, anywhere, providing a seamless and consistent user experience.
Conclusion
CloudApper Dashboards and Reporting empower UKG users to take control of their data, transforming it into actionable insights. With stunning dashboard designs, interactive visualizations, and easy report building, users can unlock the full potential of their UKG solution data. By seamlessly integrating captivating narratives and powerful analytics, CloudApper Dashboards and Reporting deliver a visual journey that brings data to life, empowering decision-makers to make informed choices that drive organizational success. Contact us and experience the power of data visualization with CloudApper Dashboards and Reporting today!