Table of Contents
According to a study, the human brain processes visual information 60,000 times faster than text. It’s no wonder that businesses are increasingly turning to data visualization to unlock the power of their data. However, creating separate dashboards for different user roles can be a daunting task. That’s where CloudApper Dashboards and Reporting come to the rescue, revolutionizing data visualization and empowering organizations with personalized insights. In this blog, we will explore how CloudApper can help businesses overcome the challenges of dashboard management and unleash the full potential of their data visualization capabilities.
The Power of Personalized Dashboards
Effective data-driven decision-making requires tailored insights for different user roles. CloudApper Dashboards offer separate dashboards for employees, managers, and admins, ensuring that each user group receives the relevant information they need. These personalized dashboards empower users to gain a comprehensive understanding of their data, resulting in more efficient workflows and improved productivity.
Story-Driven Dashboard Designs
CloudApper’s revolutionary “story-driven” dashboard designs transform complex data into engaging narratives. By seamlessly integrating captivating narratives and interactive graphics, these dashboards bring data to life, making it effortless for UKG customers to embark on a visual journey. This storytelling approach not only simplifies data comprehension but also enhances the impact of the insights gained.
Customized Data Visualizations
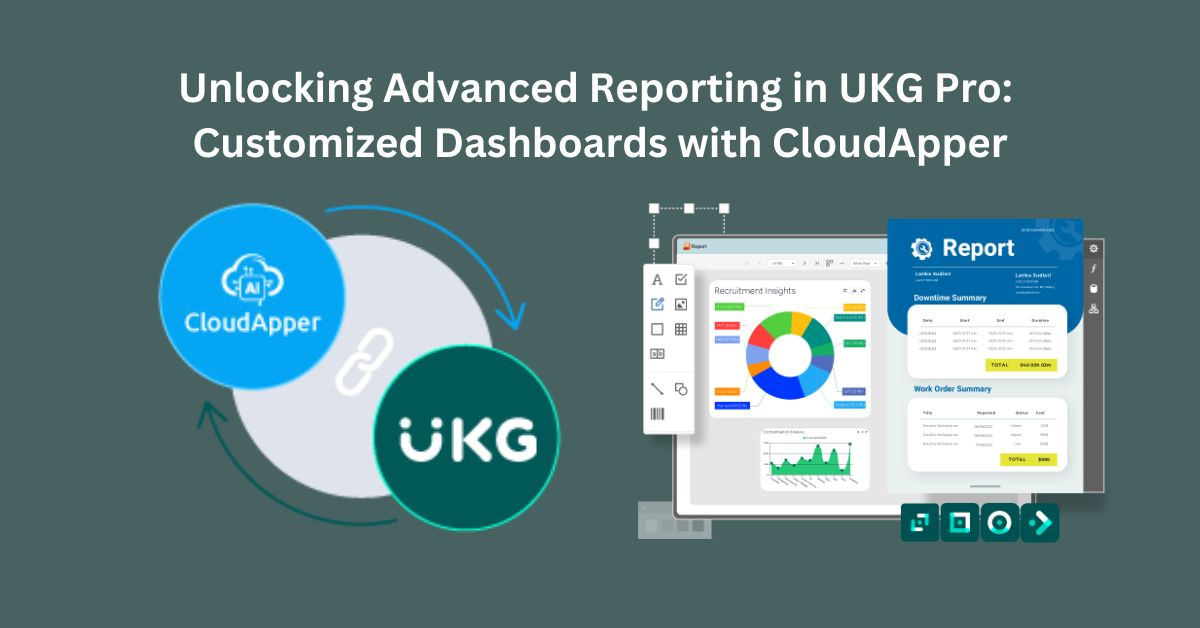
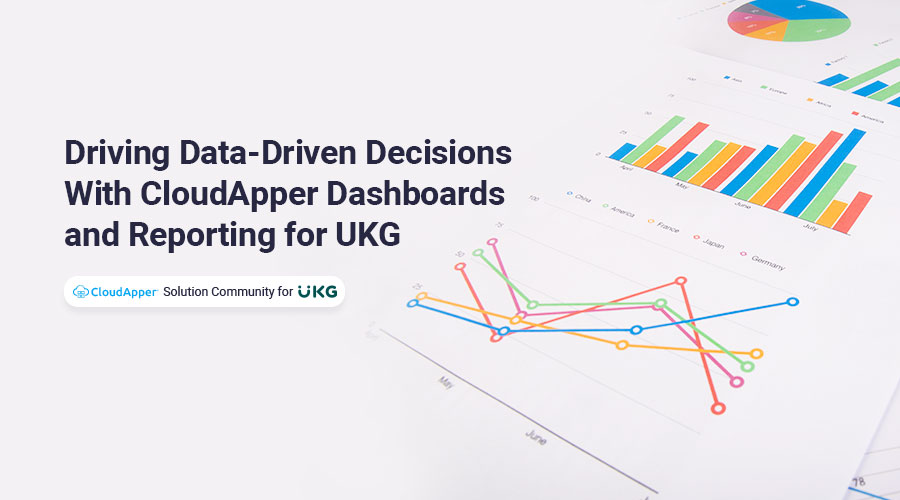
CloudApper Dashboards and Reporting offer customizable data visualizations, empowering users to create personalized reports quickly and efficiently. With a powerful reporting engine, businesses can generate a range of report types, including tabular reports, subreports, and charts. These interactive and visually appealing visualizations enable users to delve deeper into their data, uncovering actionable insights and supporting informed decision-making.
AI-Powered Insights
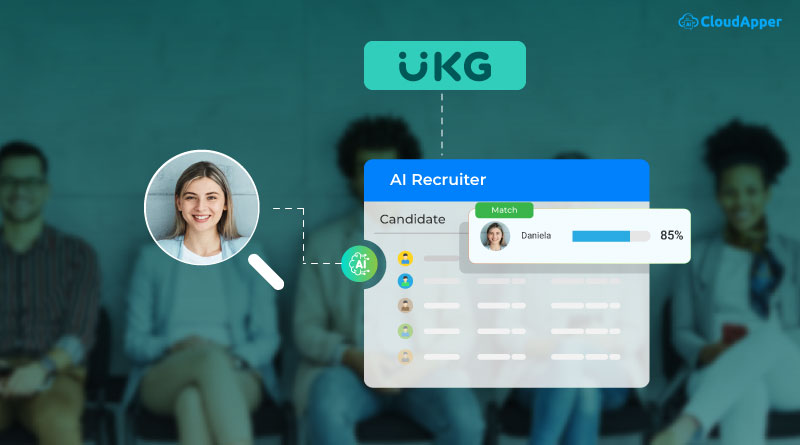
CloudApper harnesses the power of AI to deliver compelling insights through its dashboards and reports. The AI-driven capabilities enhance data analysis, allowing users to identify patterns, trends, and correlations within their data effortlessly. With AI-powered visualizations, businesses can gain a deeper understanding of their UKG solution data, facilitating proactive decision-making and driving operational excellence.
Seamless Integration and Deployment
CloudApper Dashboards and Reporting seamlessly integrate with UKG, providing a unified and comprehensive analytics platform. This integration enables businesses to leverage their UKG solution data, transforming it into stunning dashboards and customized data visualizations. Moreover, CloudApper’s solution can be easily deployed across web and mobile platforms, ensuring accessibility and usability for users on the go.
Conclusion
CloudApper Dashboards and Reporting offer a powerful solution for organizations seeking to optimize their data visualization capabilities. By providing separate dashboards for employees, managers, and admins, CloudApper ensures that each user group receives tailored insights, empowering them to make informed decisions. With story-driven dashboard designs, customizable data visualizations, AI-powered insights, and seamless integration with UKG, CloudApper unlocks the full potential of data, enabling businesses to drive success in an increasingly data-centric world.
Contact us and take control of your UKG data today and unleash the power of CloudApper Dashboards and Reporting for enhanced decision-making and operational excellence.


