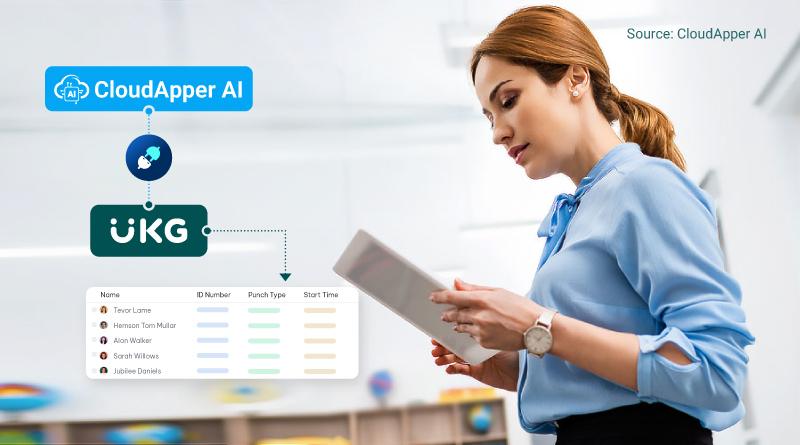
Transform UKG Pro data into actionable workforce intelligence with UKG Pro custom report and BI dashboard builders. This guide covers native reporting basics, limitations, and how CloudApper enables story-driven, interactive dashboards—combining UKG + third-party data for real-time KPIs, automation, and proactive insights across HR and operations.


Table of Contents
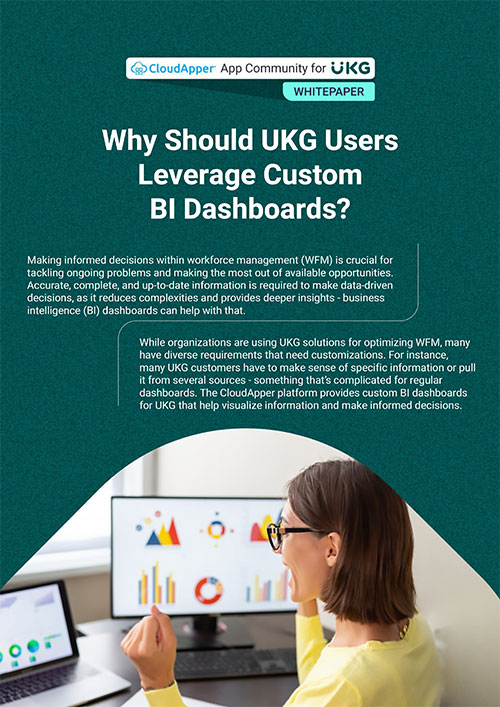
Imagine walking into your Monday morning leadership meeting with the ability to answer any workforce question—not with a “let me get back to you,” but with a live, visual story that highlights exactly where your organization is winning and where it needs help. In the high-stakes world of Human Capital Management, data is your most valuable currency, but only if you can spend it wisely. If you are a UKG Pro customer, you already have a goldmine of information, yet for many, extracting that value feels like an uphill battle. This is precisely where a UKG Pro Custom Report & BI Dashboard Builder shifts from a technical tool to a strategic weapon.
In this guide, we will explore how to move beyond basic spreadsheets and unlock the full potential of your UKG Pro data. We’ll cover everything from the fundamentals of UKG Business Intelligence to the modern, automated way to visualize your workforce using CloudApper’s customizable reporting solutions. Whether you are looking to track turnover trends, manage overtime spend, or ensure compliance at a glance, this guide is your blueprint for data-driven success.
TL;DR
UKG Pro custom report and BI dashboard capabilities turn raw data into proactive workforce intelligence—moving from static rows to visual, story-driven insights. Native UKG tools (via Cognos BI) handle basic reports but struggle with complexity, third-party integration, and mobile access. CloudApper enhances this with drag-and-drop builders, automated scheduling, interactive widgets, role-based views, real-time sync, and no-code customization—ideal for tracking headcount, overtime, compliance, turnover, labor costs, and more. Benefits: instant answers in meetings, trend analysis, compliance dashboards, and bridging data silos for strategic decisions. Setup is fast, mobile-friendly, and integrates seamlessly with UKG Pro.

The Evolution of Reporting: From Rows to Results
For years, HR reporting was a reactive process. A manager would request a report, an analyst would export a CSV, and three days later, a static PDF would land in an inbox. By the time the data was reviewed, it was already obsolete.
Modern workforce management requires a proactive approach. A UKG Pro Custom Report & BI Dashboard Builder allows you to transform raw data points—like punch times, benefit elections, and certification dates—into a live narrative. This transition from “Reporting” (telling you what happened) to “Business Intelligence” (telling you why it happened and what will happen next) is what separates industry leaders from the rest.
How to Create Custom Reports in UKG Pro
UKG Pro offers a robust Business Intelligence (BI) engine powered by IBM Cognos. For many users, this is the primary way to build custom views of their data. Here is a simplified look at the manual process:
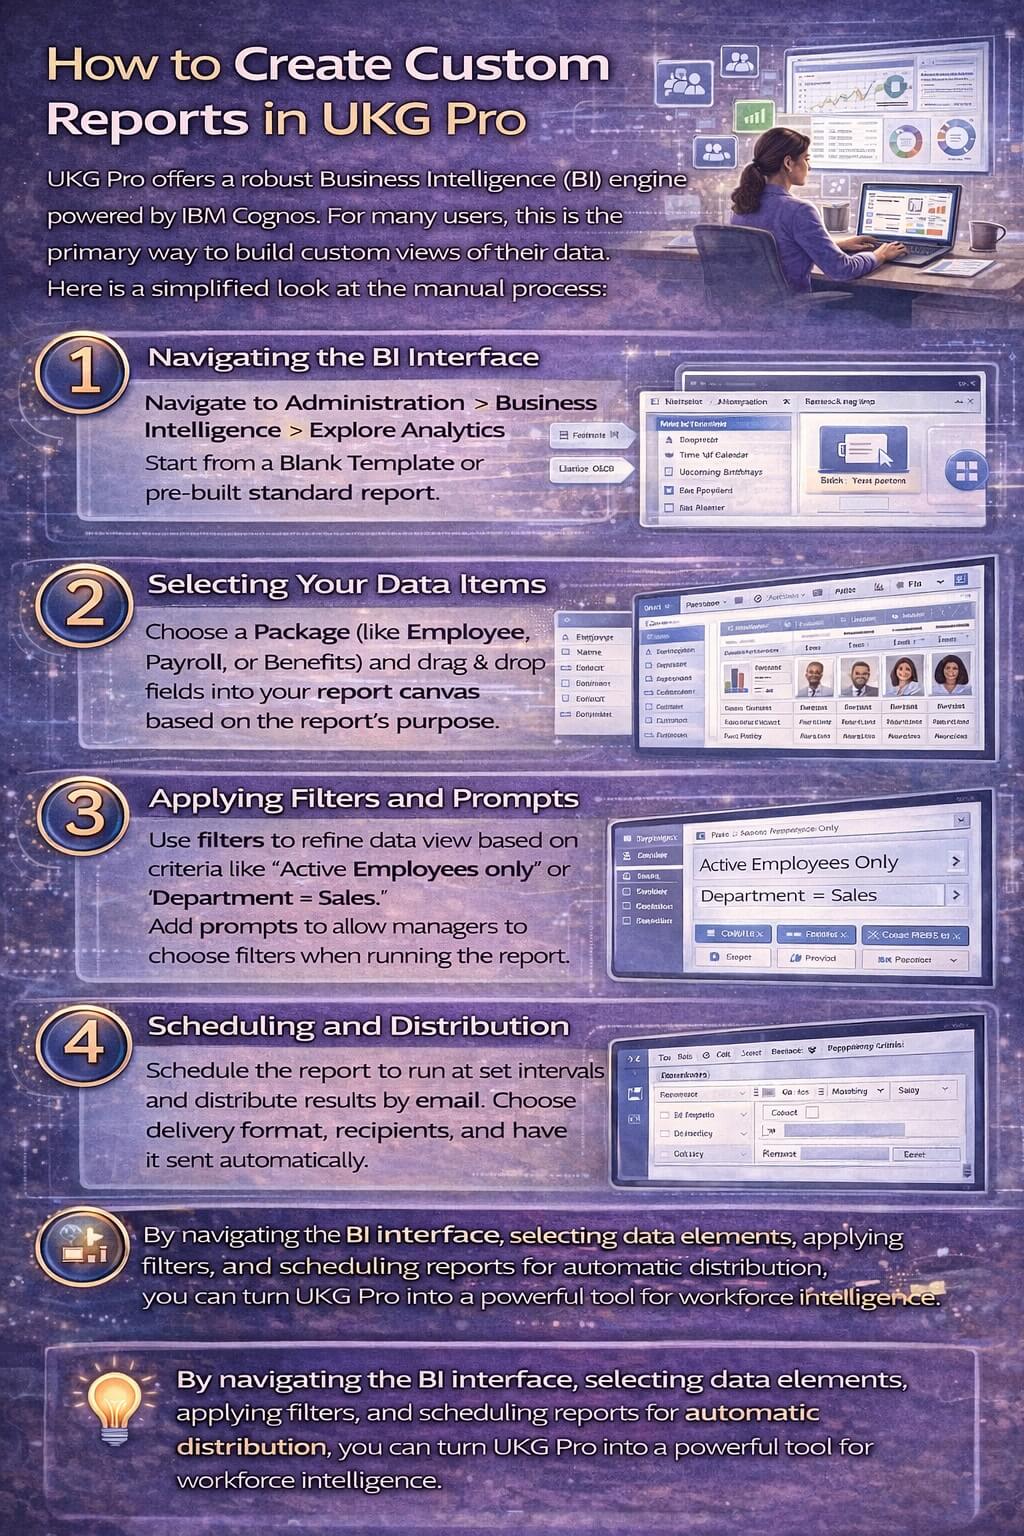
1. Navigating the BI Interface
To start building, navigate to Administration > Business Intelligence > Explore Analytics. This is the heart of your UKG reporting environment. You can choose to start from a “Blank Template” or use one of the many pre-built standard reports as a foundation.
2. Selecting Your Data Items
The “Package” you choose (such as Employee, Payroll, or Benefits) determines which fields are available. You simply drag and drop elements—like Employee Name, Department, and Pay Rate—into your report canvas. The key to a successful custom report is starting with the end in mind: what specific question are you trying to answer?
3. Applying Filters and Prompts
A report that shows every employee in the company is rarely useful. Use filters to narrow your data down to specific parameters, such as “Active Employees only” or “Department = Sales.” Prompts allow users to choose these filters when they run the report, making a single custom report useful for multiple managers.
4. Scheduling and Distribution
Once your report is built, you can schedule it to run at set intervals (daily, weekly, or monthly) and have the results emailed directly to stakeholders. This ensures that the right data reaches the right hands without manual intervention.
Building an Interactive BI Dashboard Within UKG Pro
While reports are great for detailed lists, dashboards are superior for high-level decision-making. A UKG Pro dashboard uses “widgets” to display KPIs (Key Performance Indicators) visually.
-
Widget Personalization: You can customize your homepage widgets to show real-time metrics like “Total Headcount” or “Open Requisitions.”
-
Role-Based Views: Not everyone needs to see everything. You can build specific dashboard layouts for Executives (focusing on labor costs and attrition) and different views for Plant Managers (focusing on overtime and safety compliance).
Why Standard Reporting Often Hits a Wall
Despite the power of the built-in UKG BI engine, many customers find that as their needs grow, the complexity of the tool becomes a barrier. Common hurdles include:
-
Technical Complexity: Building advanced “joined” reports across different data packages often requires specialized training or IT support.
-
Data Silos: UKG BI is excellent for UKG data, but it can be difficult to pull in data from third-party systems like your separate CRM, POS, or specialized Learning Management System.
-
Static Visuals: While functional, the standard visualizations can sometimes feel rigid, making it difficult to create the “story-driven” dashboards that modern executives expect.
A Modern Alternative: CloudApper’s Customizable BI Dashboard Builder for UKG Pro
This is where CloudApper’s customizable reporting solution changes the game. It is designed for UKG Pro customers who need the power of big data without the technical headache.
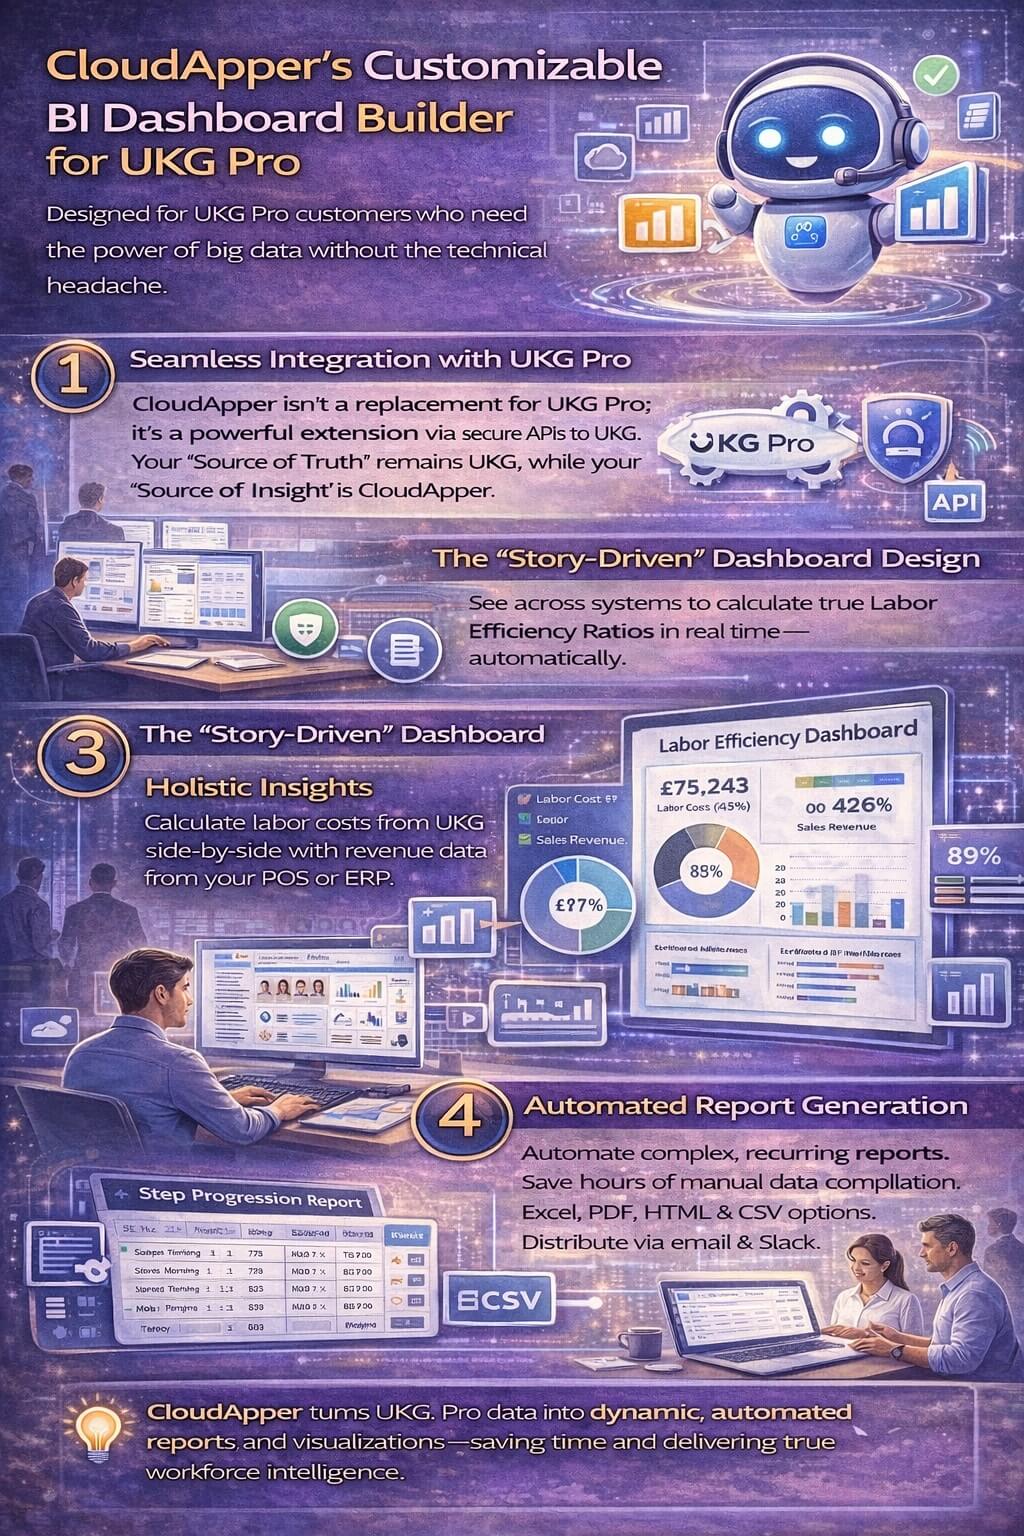
Seamless Integration with UKG Pro
CloudApper isn’t a replacement for UKG Pro; it is a powerful extension. By integrating seamlessly with UKG Pro via secure APIs, CloudApper pulls your raw workforce data and transforms it into actionable insights. It clears the path for true automation, ensuring your “Source of Truth” remains UKG while your “Source of Insight” is CloudApper.
The “Story-Driven” Dashboard Design
CloudApper moves beyond simple bar charts. It allows you to create story-driven dashboards that combine data from UKG and third-party systems.
-
Holistic Insights: See your labor costs (from UKG) side-by-side with your revenue data (from your POS or ERP) to calculate true Labor Efficiency Ratios in real-time.
Automated Report Generation
Tired of manually building the same report every month? CloudApper allows you to automate any reporting need. Whether it’s a complex “Step Progression” report for payroll or a “Certification Expiry” dashboard for compliance, the system handles the calculations and distribution automatically.
Leveraging CloudApper for Other UKG Needs
The power of CloudApper extends far beyond reporting. Because it is a unified AI platform, you can use it to automate and customize several other HR workflows that feed into your data:
-
CloudApper AI Recruiter: For high-volume hiring at scale, this solution automates candidate screening and scheduling, ensuring your “Time-to-Hire” data in your reports looks better than ever.
-
hrPad: A tablet-based solution that automates time capture and employee self-service, ensuring that the raw data entering your UKG system (and eventually your reports) is 100% accurate.
FAQ: UKG Pro Custom Report
What is a UKG Pro custom report and how does it support workforce intelligence?
A UKG Pro custom report pulls and visualizes data from UKG Pro (e.g., payroll, benefits, time) into tailored formats—charts, tables, KPIs—for deeper insights. It enables workforce intelligence by tracking trends like turnover, overtime, compliance, and labor efficiency in real time.
How do I create a UKG Pro custom report natively?
In UKG Pro, navigate to the BI interface → select data sources → apply filters/joins → choose visuals → add calculations → schedule delivery. It’s powerful but often requires training for advanced features like complex joins or third-party data.
What are the main limitations of native UKG Pro reporting?
Native tools focus mainly on UKG data, lack easy third-party integration (e.g., POS, CRM), require IT/specialist help for advanced visuals, offer limited mobile access, and produce static outputs instead of interactive, story-driven dashboards.
How does CloudApper improve UKG Pro custom report and dashboard capabilities?
CloudApper provides a no-code, drag-and-drop builder for UKG Pro custom reports and BI dashboards—adding real-time sync, mobile views, third-party data blending, automated scheduling, role-based personalization, and story-driven design (widgets, gauges, trends) without replacing native UKG BI.
What kinds of dashboards can I build with a UKG Pro custom report solution?
Interactive dashboards for headcount trends, overtime spend, certification expiry, turnover analysis, labor cost vs. revenue (with POS integration), step progression tracking, compliance monitoring, and executive summaries—tailored by role (e.g., plant manager vs. C-level).
Is CloudApper easy to integrate with UKG Pro for custom reporting?
Yes—secure API connection pulls UKG data in real time, supports mobile apps (iOS/Android), deploys in weeks, requires no coding, and allows combining UKG with external sources for comprehensive workforce intelligence.
The Bottom Line: Data is Only Power if You Can Use It
Your UKG Pro Custom Report & BI Dashboard Builder should not be a source of frustration—it should be a source of clarity. By combining the enterprise-grade foundation of UKG Pro with the flexible, automated, and visual power of CloudApper, you can finally bridge the gap between having data and having answers.
Don’t settle for row-and-column reporting. Elevate your workforce management with real-time insights that drive action and prove the value of your HR strategy every single day.
Ready to transform your UKG Pro data into a competitive advantage? Discover how CloudApper can personalize your UKG Pro reports and dashboards today.