Table of Contents
With the increasing complexity of workforce management, companies require accurate data to make informed decisions. This is where UKG comes in. UKG offers a comprehensive suite of HCM solutions that help companies manage their workforce effectively. However, it can be challenging to make sense of the vast amounts of data generated by UKG solutions. This is where CloudApper comes in as a non-technical toolkit to create custom functionality and data exchange connectors for UKG solutions.
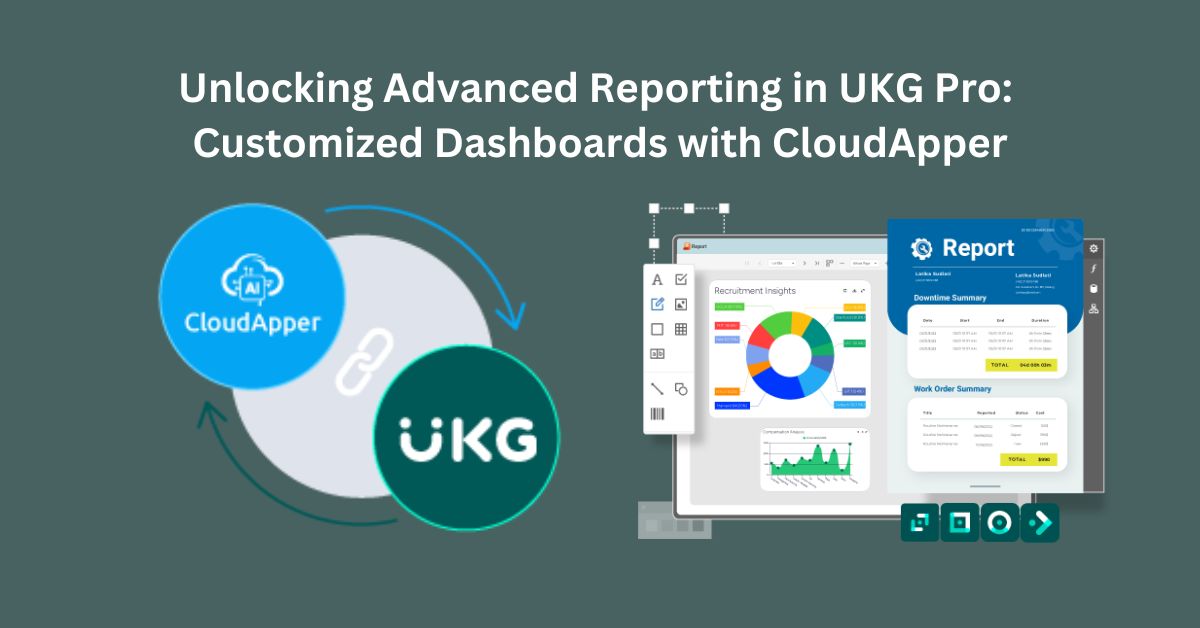
CloudApper is a highly customizable, drag-and-drop style platform that can display personalized workforce dashboards for key decision-makers. Unique business intelligence (BI) dashboards and custom reports can be quickly created to visualize important data from your UKG solutions and third-party systems. In this blog post, we’ll dive into how CloudApper can help businesses make sense of their UKG solution data with custom dashboards and its most popular dashboards.
Customizable Dashboards for UKG: Making Sense of Data
With the vast amounts of data generated by UKG solutions, it can be challenging to make sense of it all. This is where CloudApper comes in as a highly customizable, drag-and-drop style platform that can display personalized workforce dashboards for key decision-makers. Customizable dashboards can be quickly created to visualize important data from your UKG solutions and third-party systems. The dashboards can be accessed from a web browser or through the CloudApper mobile app (Android & iOS).
CloudApper can integrate directly with UKG solutions and third-party systems to import data, transform it with our robust workflow engine, and create visualizations that streamline decision-making processes. By integrating with UKG solutions, CloudApper can provide valuable insights into your workforce data. These insights can help companies make data-driven decisions that can positively impact their bottom line.
For example, a company that uses UKG solutions to manage its workforce could use CloudApper to create a customizable dashboard that displays data on employee performance. The dashboard could display metrics such as employee productivity, attendance, and turnover rates. This information could be used to identify top-performing employees and develop strategies to improve employee retention.
Predictive Analytics Dashboard: Measure Employee Retention and Performance
One of CloudApper’s most popular dashboards is the predictive analytics dashboard. This dashboard uses machine learning algorithms to identify trends in employee behavior and predict future outcomes. The dashboard can be used to measure employee retention and performance, enabling companies to develop strategies to retain top-performing employees.
For example, a company that has experienced high turnover rates could use the predictive analytics dashboard to identify the factors that contribute to employee turnover. The dashboard could identify commonalities between employees who have left the company, such as dissatisfaction with compensation or a lack of career advancement opportunities. With this information, the company could develop strategies to retain top-performing employees, such as offering better compensation packages or providing more career advancement opportunities.
Compensation Dashboard: Monitor Employee Pay Ranges and Groups
Another popular dashboard offered by CloudApper is the compensation dashboard. This dashboard displays all employee pay ranges and groups, enabling companies to monitor compensation and ensure that employees are being paid fairly.
For example, a company that has experienced complaints from employees about unequal pay could use the compensation dashboard to identify pay discrepancies. The dashboard could identify employees who are being paid less than their peers, enabling the company to rectify the situation and ensure that all employees are being paid fairly.
Employee Information Dashboard: Employment History and Performance
The employee information dashboard is another popular dashboard offered by CloudApper. This dashboard displays important employee information, such as employment history and performance.
For example, a company that is considering promoting an employee to a management position could use the employee information dashboard to assess the employee’s performance and work history. The dashboard could display the employee’s previous roles and responsibilities, as well as their performance ratings. With this information, the company can make an informed decision about whether the employee is a good fit for the management position.
Workforce Diversity Dashboard: Track Gender Equity and Ethnicity
The workforce diversity dashboard is an essential tool for companies that prioritize diversity and inclusion. This dashboard displays data on gender equity, and ethnicity, enabling companies to track their progress towards creating a diverse and inclusive workplace.
For example, a company that is committed to promoting diversity and inclusion could use the workforce diversity dashboard to track its progress. The dashboard could display data on the company’s demographics, such as the percentage of employees who identify as women, or members of different communities. With this information, the company can identify areas where it needs to improve and develop strategies to promote diversity and inclusion.
Recruitment Dashboard: Identify Universities with High-Performing Employees
The recruitment dashboard is an essential tool for companies that want to attract top talent from universities. This dashboard displays data on the performance of employees who graduated from different universities, enabling companies to identify the universities that produce the highest-performing employees.
For example, a company that wants to attract top talent from universities could use the recruitment dashboard to identify the universities that produce the highest-performing employees. The dashboard could display data on the performance of employees who graduated from different universities, enabling the company to focus its recruitment efforts on the universities that produce the highest-performing employees.
Conclusion
In conclusion, CloudApper is a highly customizable, drag-and-drop style platform for UKG that can display personalized workforce dashboards for key decision-makers. Unique business intelligence (BI) dashboards and custom reports can be quickly created to visualize important data from UKG solutions and third-party systems. With its most popular custom dashboards, such as the predictive analytics dashboard, compensation dashboard, employee information dashboard, workforce diversity dashboard, and recruitment dashboard, companies can make data-driven decisions that can positively impact their bottom line. By providing valuable insights into workforce data, CloudApper helps companies make informed decisions that promote efficiency and productivity.


