Explore five custom dashboards by CloudApper for UKG solutions, designed to help organizations visualize key data, improve decision-making, and optimize workforce management. From predictive analytics to diversity insights, these dashboards enhance the value of your UKG (Kronos) solutions.

Table of Contents
UKG (Kronos) solutions are designed to help organizations manage their workforce, but it can be challenging to make sense of the data generated by these systems. BI Dashboards & Reports by CloudApper is a powerful solution for displaying key metrics and visualizing complex data. In this blog, we will explore five custom dashboards for UKG solutions that can help you get the most out of your UKG solution and make better decisions for your organization.
Top Custom Dashboards For UKG Solutions
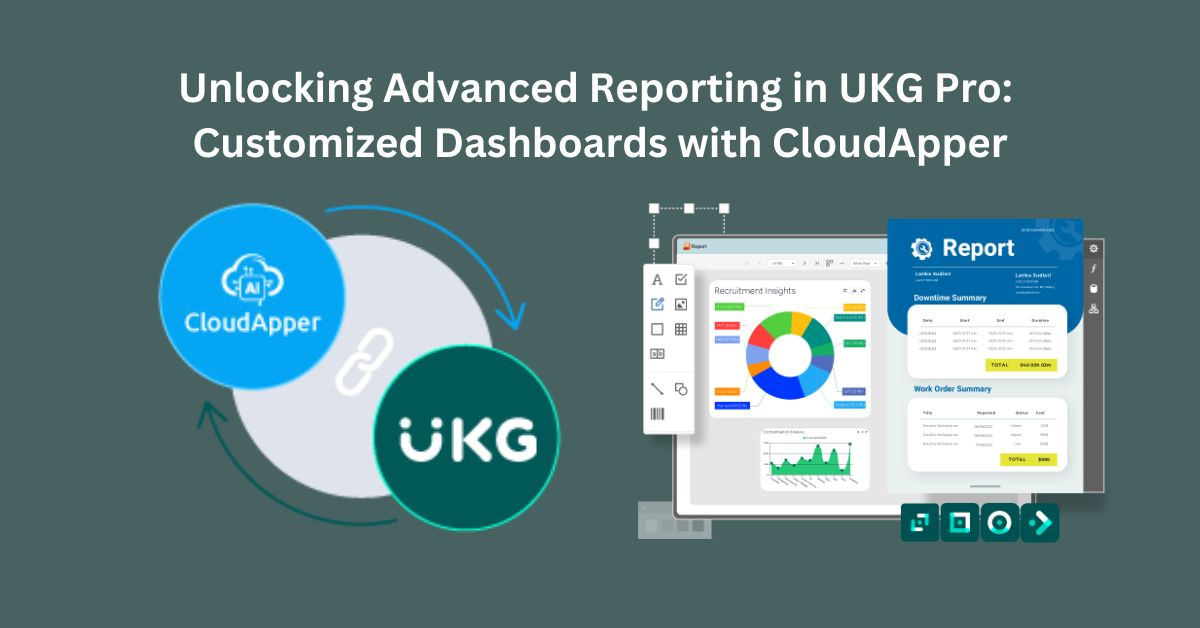
CloudApper’s Custom Dashboards for UKG (Kronos) Solutions is a highly customizable, drag-and-drop solution for UKG (Kronos). That enables businesses to have personalized dashboards and reports to visualize key data from their UKG solutions. With CloudApper, businesses can access unique business intelligence (BI) dashboards and custom reports to streamline their decision-making processes. CloudApper integrates with UKG solutions to pull data, transform it with a robust workflow engine, and create visualizations that are tailored to specific business needs. Here are the top dashboards by CloudApper for UKG solutions:
Predictive Analytics Dashboard
A predictive analytics dashboard is a powerful tool for measuring employee retention and performance. It uses historical data to predict future trends and improve employee retention and performance. By analyzing factors such as tenure, job title, and compensation, you can identify patterns and take proactive steps to retain top talent.
Implementing CloudApper’s custom dashboards has revolutionized our approach to workforce management. The detailed insights into compensation and diversity have been invaluable in making data-driven decisions.” – HR Director, Financial Services Industry
Compensation Dashboard
The compensation dashboard provides an overview of all employee pay ranges and groups. This allows you to see how compensation is distributed across the organization and identify any areas where pay disparities may exist. You can use this information to ensure that compensation is fair and equitable and make data-driven decisions about salary increases, promotions, and bonuses.
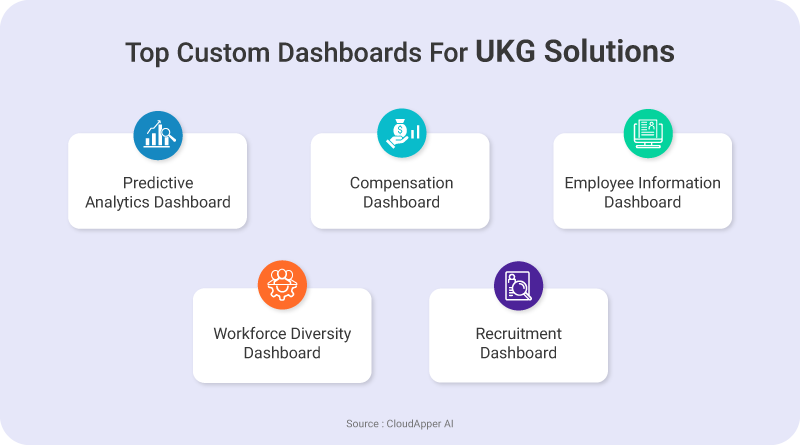
Employee Information Dashboard
The employee information dashboard provides a comprehensive view of employment history and performance. This dashboard is useful for tracking employee performance over time and identifying areas where additional training or coaching may be needed. You can also use this dashboard to track employee tenure and identify opportunities for career development and succession planning. By having a holistic view of employee information, you can make informed decisions about promotions, transfers, and performance improvement plans.
Workforce Diversity Dashboard
The workforce diversity dashboard provides insights into race, gender equity, and ethnicity information across the organization. It is a powerful tool for ensuring that your organization is meeting diversity and inclusion goals and identifying areas where additional action may be needed. By tracking diversity metrics, you can make data-driven decisions about hiring, promotion, and training programs to ensure that your organization is inclusive and representative of the communities you serve.
Recruitment Dashboard
A recruitment dashboard is a powerful tool that can help organizations identify universities that have produced high-performing employees in the past. With CloudApper’s recruitment dashboard for UKG Solutions, businesses can easily analyze historical data to determine the most effective hiring sources and make data-driven decisions to optimize their recruitment strategy.
UKG solutions can provide organizations with a wealth of data, but to optimize decision-making, it is essential to use dashboards that display this data in a way that is actionable and easy to understand. The five dashboards discussed in this blog can enhance UKG solutions to make informed decisions about their workforce and optimize their performance. By leveraging these dashboards, organizations can gain a competitive advantage and position themselves for success in the future. If you want to implement these dashboards for your UKG solutions, please get in touch with us today.
Key Takeaways
- Predictive Analytics: Use historical data to forecast future trends in employee retention and performance.
- Compensation Overview: Visualize pay distribution to identify and address disparities.
- Employee Information: Track performance and tenure to inform decisions on promotions and training.
- Diversity Insights: Monitor diversity metrics to ensure inclusivity and representation.
- Recruitment Analysis: Identify effective hiring sources and optimize recruitment strategies.
FAQ
Q: What is CloudApper’s Custom Dashboards for UKG Solutions?
A: CloudApper’s Custom Dashboards is a solution that integrates with UKG systems to create personalized dashboards and reports. It uses a drag-and-drop interface to help businesses visualize key data and make informed decisions.
Q: How does the Predictive Analytics Dashboard benefit organizations?
A: It helps measure and improve employee retention and performance by using historical data to predict future trends, allowing organizations to take proactive steps to retain top talent.
Q: What insights can the Compensation Dashboard provide?
A: It offers an overview of employee pay ranges and groups, highlighting pay disparities and helping ensure fair and equitable compensation decisions.
Q: How does the Employee Information Dashboard aid in workforce management?
A: It provides a comprehensive view of employment history and performance, enabling better tracking of employee performance and facilitating informed decisions on promotions and career development.
Q: What is the purpose of the Workforce Diversity Dashboard?
A: It provides insights into race, gender equity, and ethnicity information, helping organizations meet diversity and inclusion goals and make data-driven decisions about hiring and promotion.
Q: How can the Recruitment Dashboard improve hiring practices?
A: It helps identify effective hiring sources by analyzing historical data on high-performing employees, optimizing recruitment strategies.
*Disclaimer: Due to privacy reasons, the identity of the person or company cannot be revealed.