CloudApper’s pay equity dashboard for UKG offers a powerful, customizable solution for tracking wage disparities. By automating data collection and analysis, organizations can quickly identify issues and take corrective action, ensuring fair and equitable compensation practices.
Table of Contents
Guaranteeing equal compensation for equal labor is crucial to eliminating bias and unfair treatment at work. Nevertheless, keeping tabs on and evaluating pay equality data may be a massive undertaking, particularly for businesses with a lot of employees. Here is where a dashboard tracking wage equality may be useful. The ability to quickly and easily spot pay disparities and take remedial action is made possible by a pay equality dashboard. This piece will explain how to use CloudApper to build a dashboard for UKG‘s pay equity report.
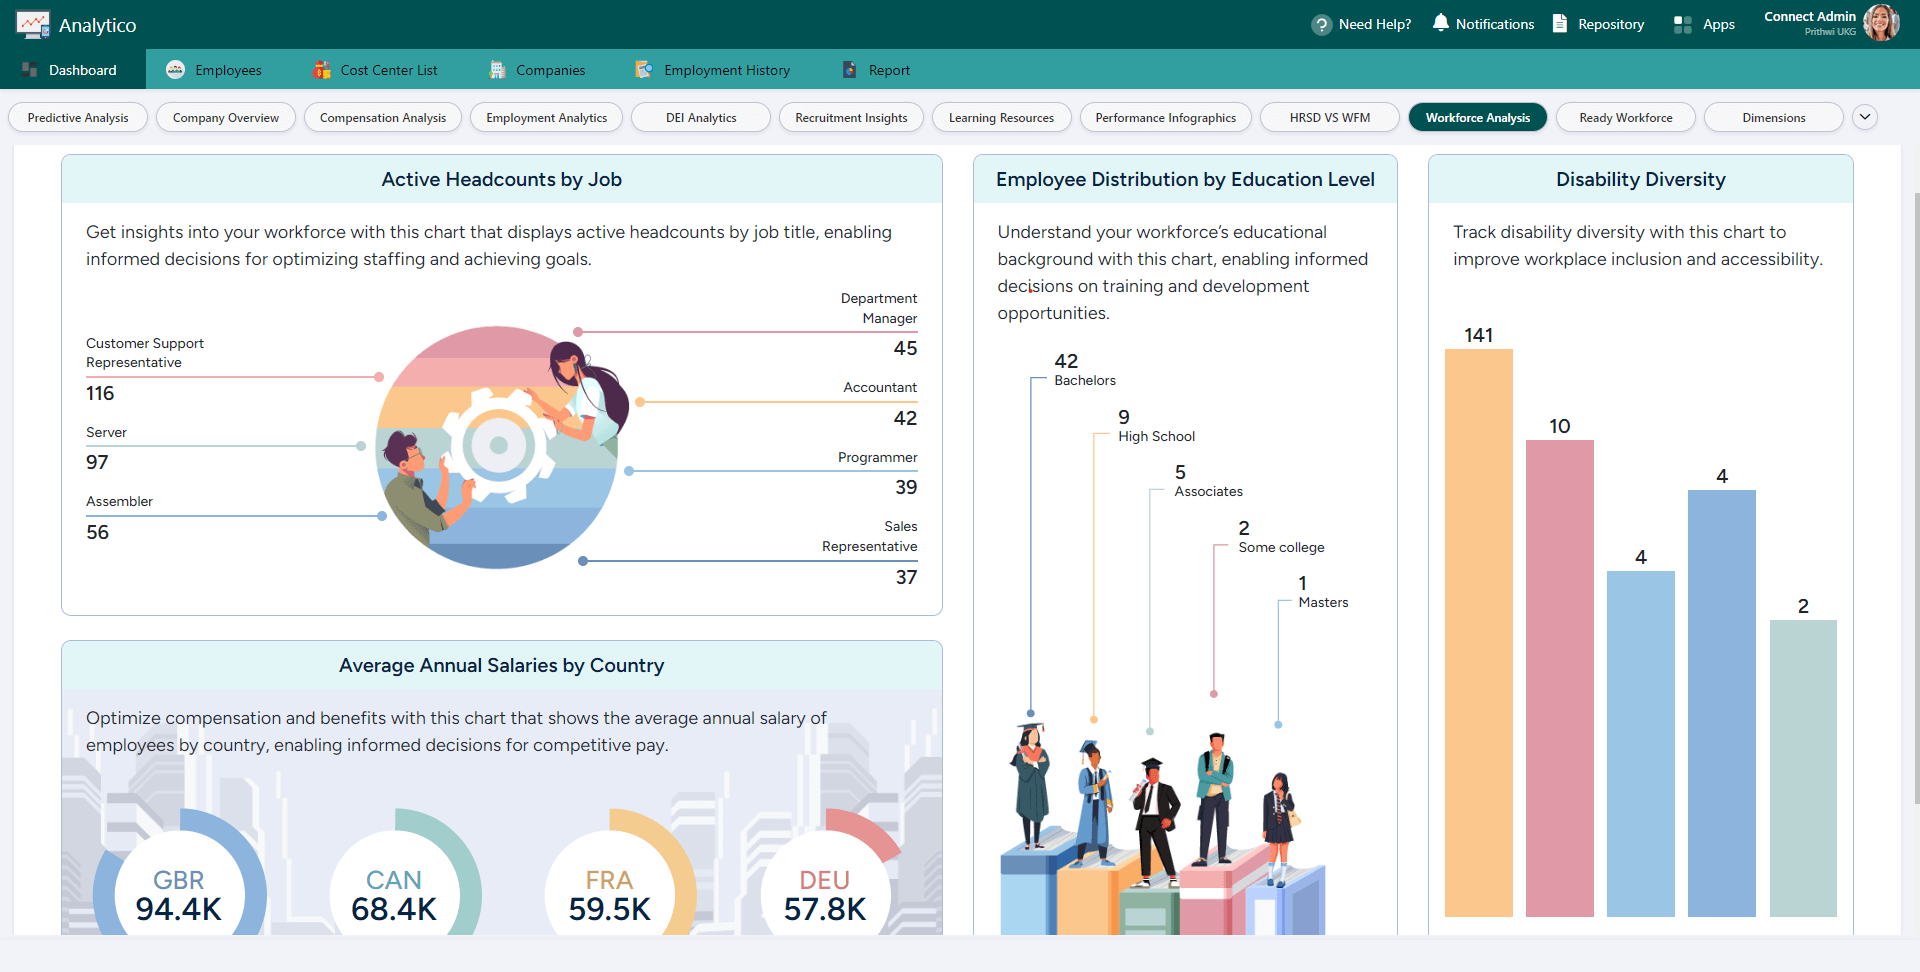
Step 1: Compile Wage Information
Connecting CloudApper with the UKG (Kronos) solution for Acquiring salary information is the first step in developing a pay equity dashboard. Your dedicated solutions specialist will help you with the entire connection process. Employee wages, job titles, years of experience, and other criteria that may affect compensation should be imported and stored in CloudApper. Validity and timeliness of the information must be guaranteed.
Step 2: Establish Metrics
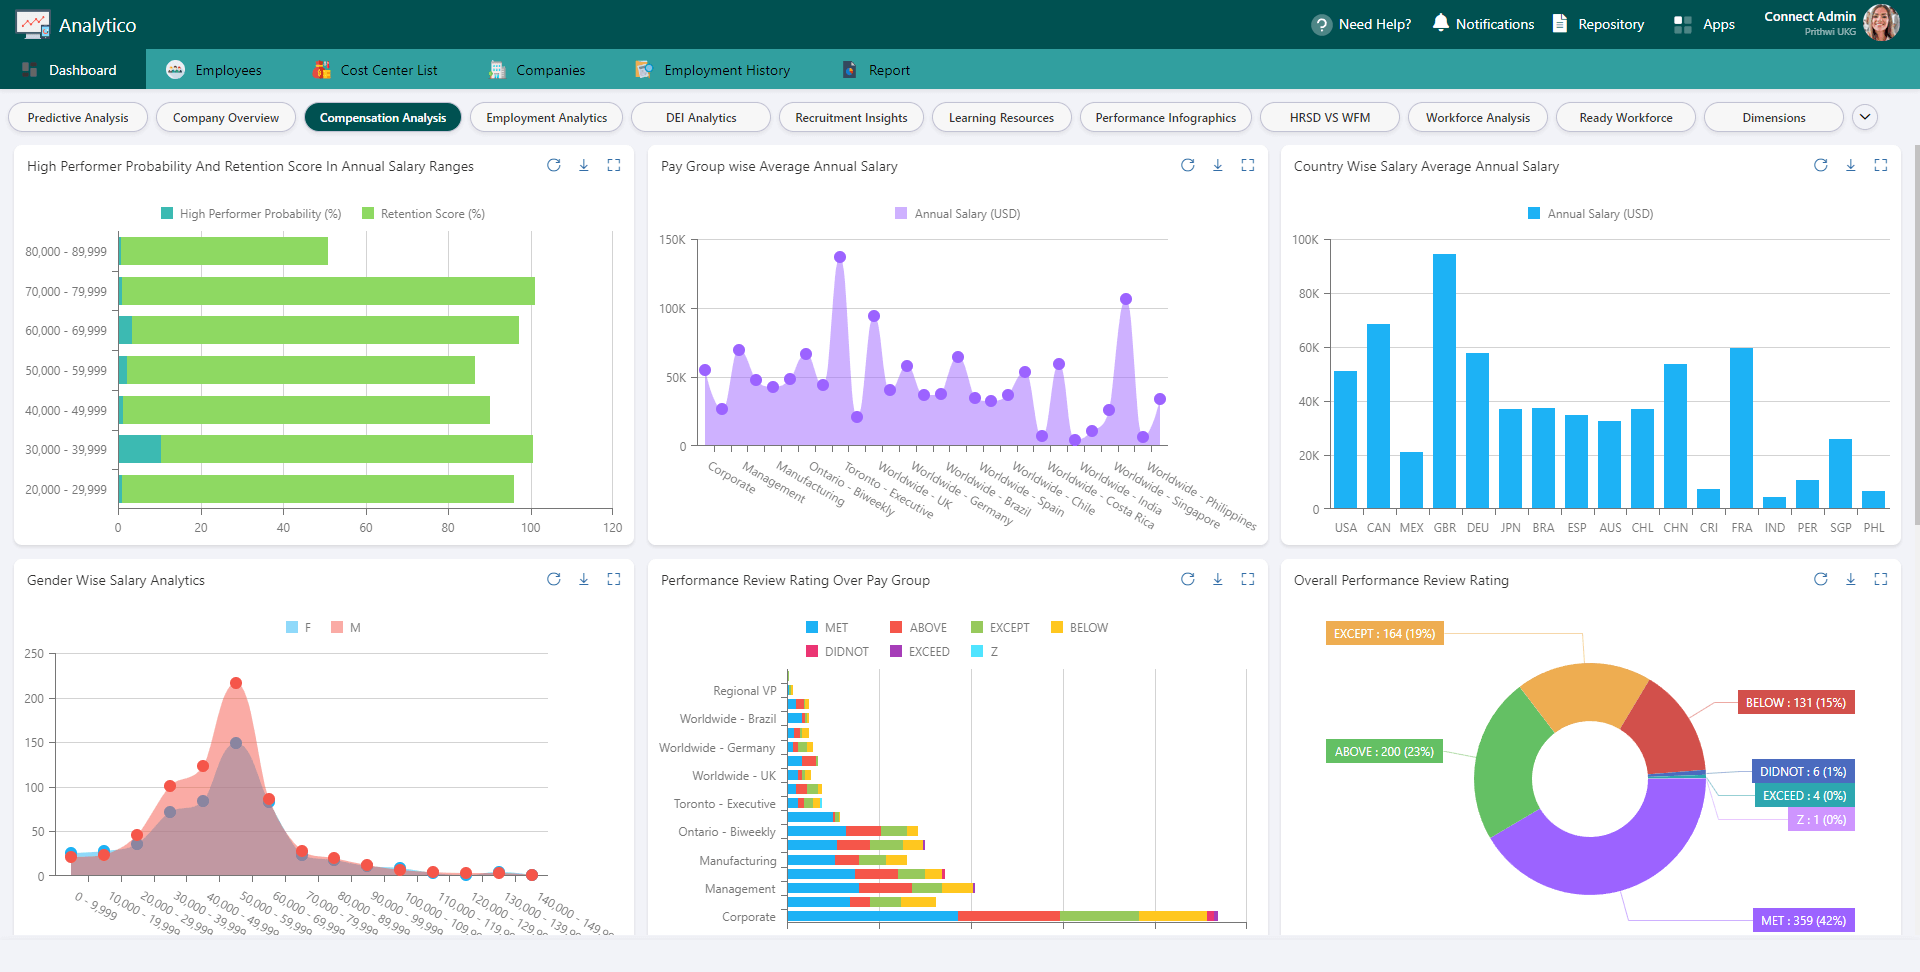
The next thing to do is decide what indicators of pay equality you want to include in your dashboard. Typical indicators include:
Overall pay gap: The gender pay gap is the difference between men’s and women’s average salaries within a company.
Equal pay for equal work: a look at the gender pay gap by industry.
Pay gap by years of experience: In order to have a better idea of how the gender pay gap manifests itself, we may look at how much men and women with the same amount of experience earn on average.
Representation by gender: With this measure, we can see what proportion of men and women are employed in various fields.
Phase 3: Make the Dashboard
It is time to build the pay equity dashboard when you have collected salary data and decided on the parameters to monitor. Your dedicated solutions specialist can build the dashboard for you or you can do it by yourself by using CloudApper’s dashboard builder, you can design a dashboard that’s tailored to your company’s requirements.
These are the steps you should take to create a dashboard for pay equity:
- After logging in, launch CloudApper’s Design Editor and go to App Designer –> Web View –> Add Chart.
- Choose a chart type to work with. Available chart types include Pie, Doughnut, Bar, Stacked Bar, Line, Area, Table, Gauge, Map, Table, Count Chart.
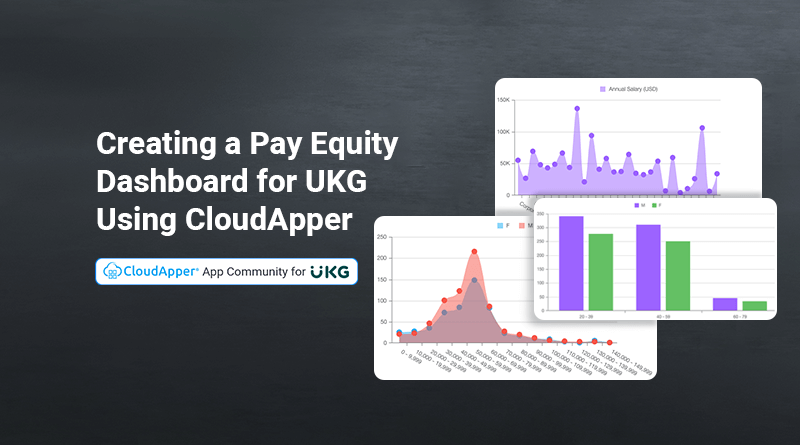
- You may now select the data you’re interested in monitoring by adding them to the chart configuration. A bar chart showing the gender wage difference or a pie chart illustrating employee breakdowns by gender would be useful additions.
- Make the dashboard show the data in a manner that makes sense to you. Color-coding or resizing the charts as seem fit for your screen or adding a trendline to indicate the development of a situation are some of the viable options.
Companies that actively monitor and address pay equity can see a 19% increase in employee satisfaction and retention.
Part 4: Examine the Information Collected
Analyzing the data from the pay equity dashboard is the next step after its creation. Examine the data for any trends or patterns that could point to wage disparities. For instance, a higher pay difference for workers with more years of experience may suggest that the company is not treating women fairly for their years of service.
Action Step 5: Make Adjustments
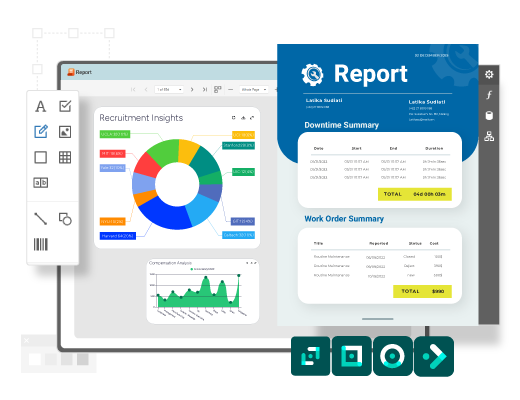
To the extent that wage disparities are discovered, steps should be taken to close them. A few examples of actions that may be taken to achieve this goal include boosting the compensation of underpaid workers, modifying the recruiting process so that all applicants are given competitive wages, and establishing new rules and practices to foster pay equality.
Key Takeaways
- Streamlined Data Collection: CloudApper seamlessly integrates with UKG to gather relevant wage data, ensuring accuracy and timeliness.
- Customizable Metrics: Users can define and monitor specific metrics such as overall pay gaps, equal pay for equal work, and gender representation.
- User-Friendly Dashboard Creation: CloudApper’s intuitive design editor allows organizations to build and customize dashboards tailored to their needs.
- Actionable Insights: The pay equity dashboard provides real-time insights, enabling organizations to identify pay discrepancies and take corrective action to promote fairness.
Conclusion
With CloudApper Solution Community, a pay equity dashboard can be easily built for UKG (Kronos), allowing for the tracking of pay equity data and the identification of possible pay discrepancies. Organizations may promote fairness and avoid discrimination in the workplace by collecting salary data, defining metrics, establishing a dashboard, evaluating the data, and taking remedial action. Making a pay equity dashboard has never been simpler than with CloudApper and its flexible dashboard maker.
FAQ
1. What is the primary purpose of a pay equity dashboard?
A pay equity dashboard is designed to help organizations track and monitor wage disparities within their workforce, ensuring fair and equal compensation for all employees.
2. How does CloudApper integrate with UKG to gather wage data?
CloudApper connects with UKG through a dedicated integration process, automatically pulling in relevant employee wage data and other criteria such as job titles and years of experience.
3. Can I customize the pay equity metrics in the CloudApper dashboard?
Yes, CloudApper allows users to define and customize metrics based on specific organizational needs, such as overall pay gaps, pay gaps by experience, and gender representation.
4. How can I use the insights from the pay equity dashboard?
The insights from the dashboard can be used to identify pay disparities, which can then inform actions such as adjusting employee wages, revising hiring practices, and implementing policies to ensure equitable pay.


