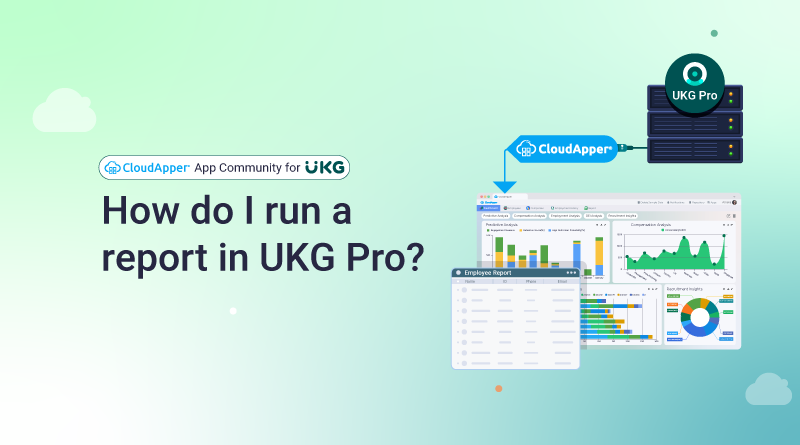
Simplify the process of creating and running reports in UKG Pro by leveraging CloudApper's robust features. This article provides step-by-step guidance on generating custom reports in UKG Pro, empowering users to make data-driven decisions effortlessly. Improve your report management and maximize the value of your data with CloudApper.
Table of Contents
Executing reports in UKG Pro is essential in analyzing and evaluating your company’s performance and formulating data-driven choices. However, creating reports and running them may take a lot of work. Generating reports in UKG Pro is a simple and straightforward procedure when using CloudApper AI. This article will walk you through creating custom reports & dashboards utilizing CloudApper’s powerful features and capabilities while demonstrating how to run regulat reports in UKG Pro. Regardless of whether you are a new or experienced user of UKG Pro, this article will help you understand the procedure for creating and running reports in UKG Pro and help you make better use of your data.
Running a Standard Report in UKG Pro
There are several ways to run a report in UKG Pro, and which one you choose will depend on the type of report you want to run and the data you want to see.
- One way to generate a report is through the UKG Pro online interface. By going to the Reports tab, selecting the required report from the drop-down menu that displays there, and then choosing the necessary options, such as the date range or the workers to be included in the report, you may select the report you want to run.
- Another option for creating a report is to use the UKG Pro mobile app. By going to the Reports tab, choosing the desired report from the drop-down menu, and then making a choice of the necessary settings, you can choose the report you want to run.
- Additionally, you may schedule reports so that they run automatically and are provided to you or any other stakeholders on a regular basis.
- Additionally, you may export the data from UKG Pro to Excel, CSV, or any of the many other accessible formats if you wish to perform extra analysis on it or import it into other systems.
Generate a Custom Report Using UKG Pro Data
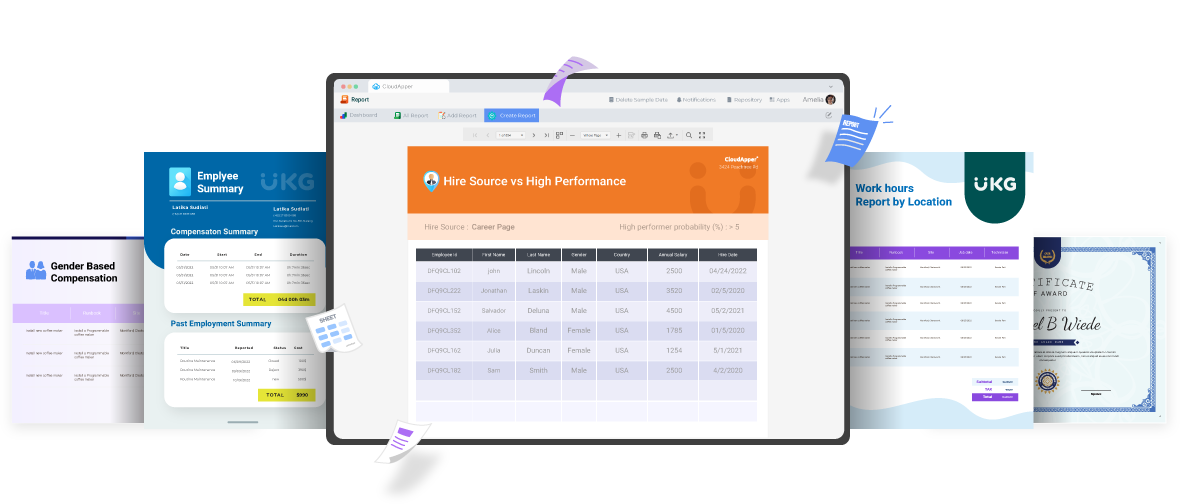
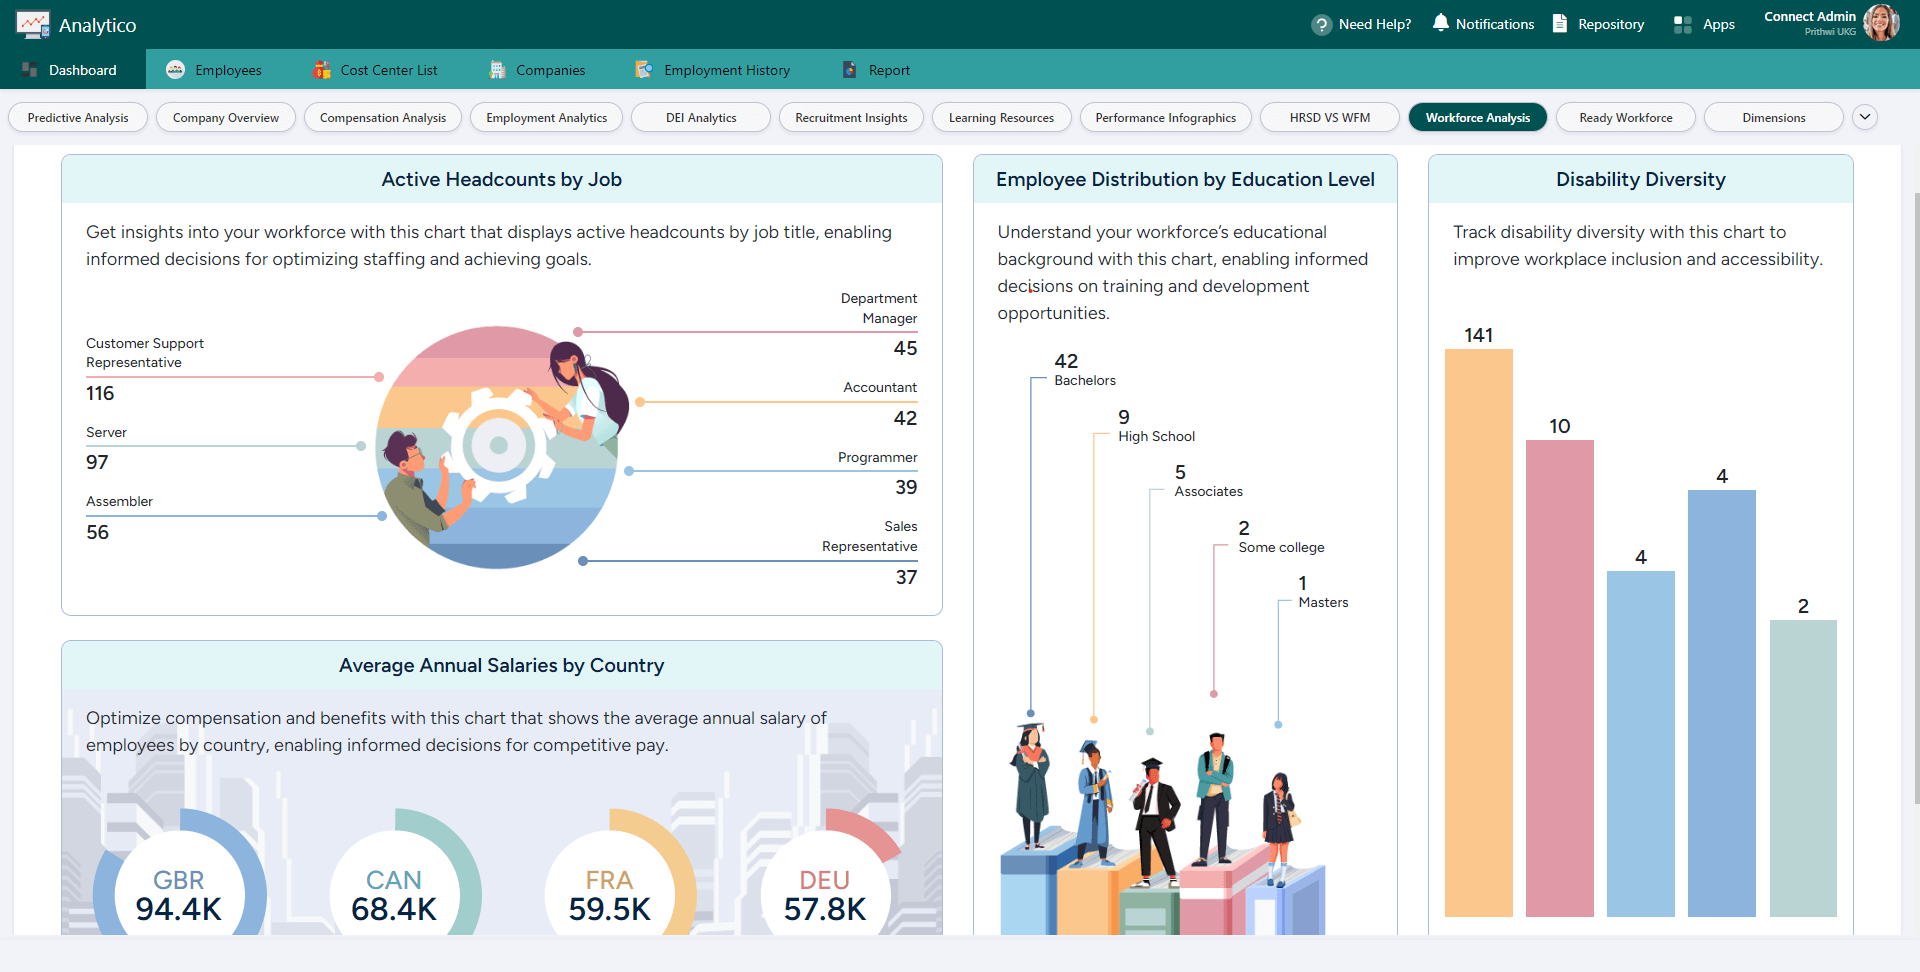
If you use CloudApper, you can use its custom reporting features with UKG data to create reports with more specialized criteria and filters and a more comprehensive range of format options. Also you can visualize these reports using personalized BI dashboards and send alerts based on the report findings.
Incorporating CloudApper with our UKG Pro solution has revolutionized how we manage and interpret workforce data. The custom reports and BI dashboards have provided us with deeper insights, allowing us to make more informed decisions and streamline our operations.”
– Chief Human Resource Officer, with over 08 years of experience in employee relationship management Healthcare Industry
Running a Personalized Report in UKG Pro Using CloudApper
Using CloudApper to generate custom reports is a simple and straight forward process. You can find a basic instruction below, but if you need more detailed guidance feel free to reach out to our solution specialists anytime:
-
Get your CloudApper account, and then go to the Reports app and open the reports module.
-
Choose the UKG data source that you wish to use in the report that you are creating.
-
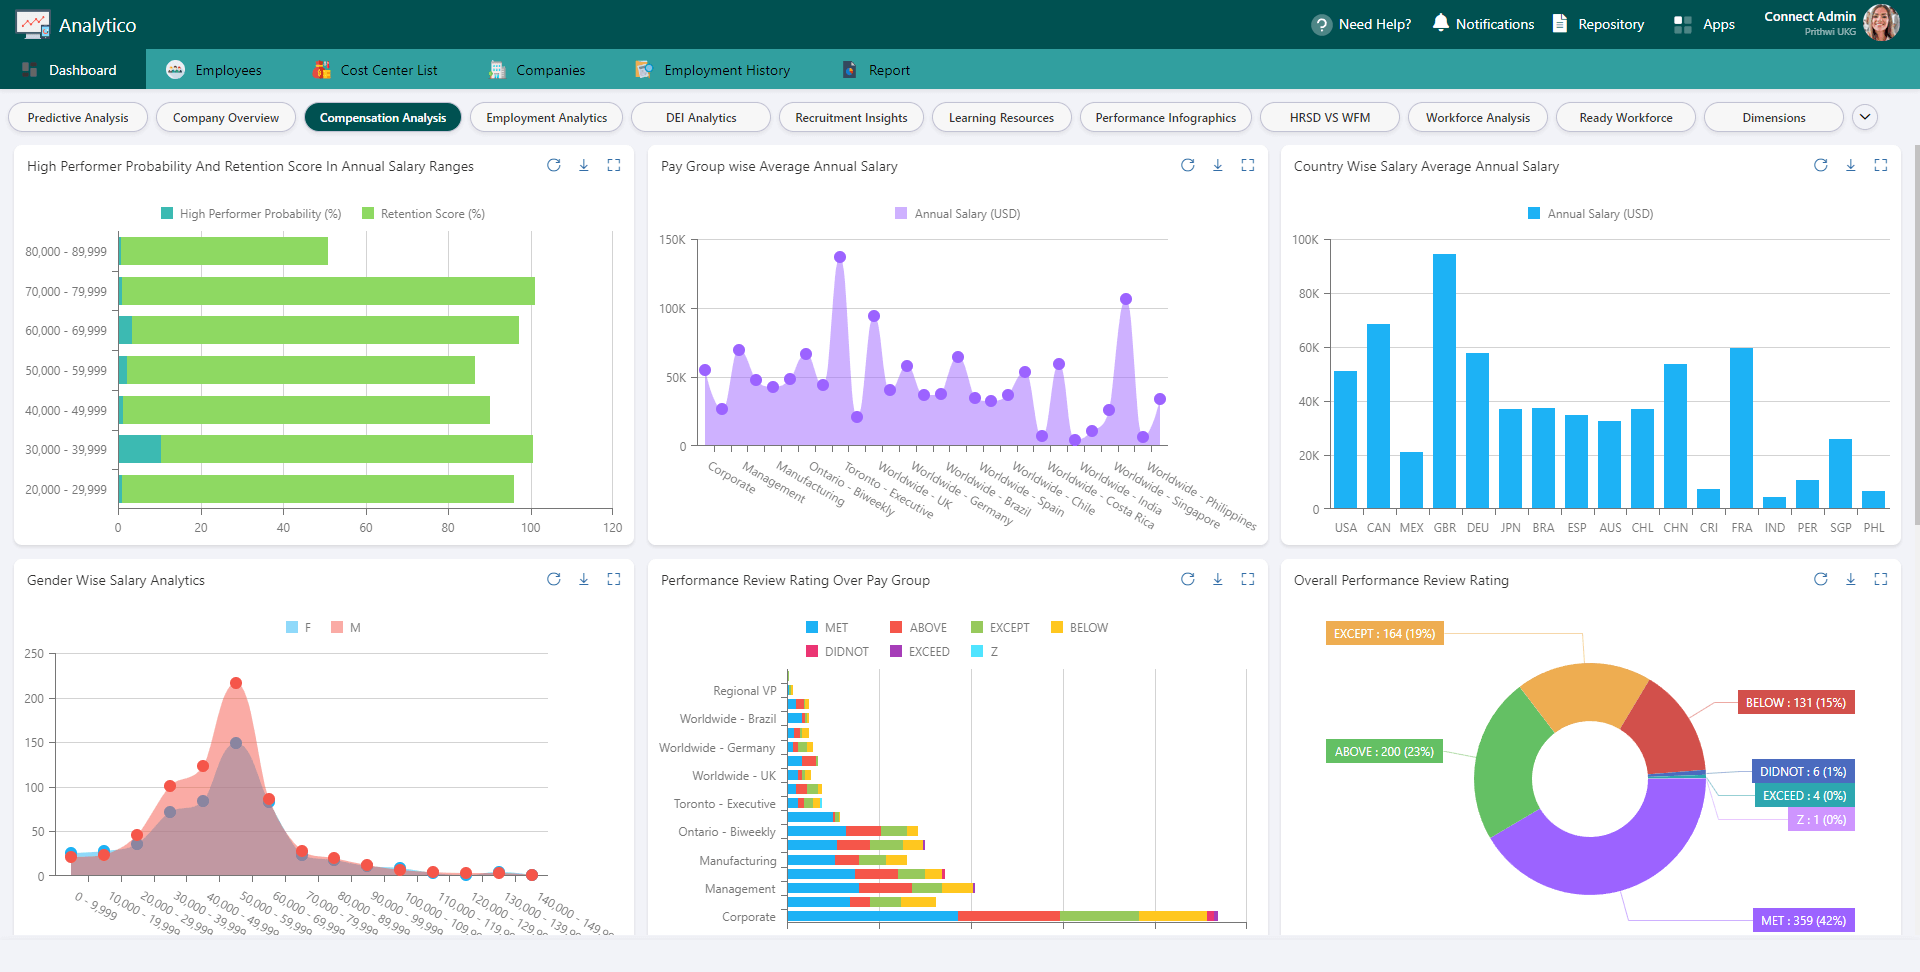
To customize the layout of your report and add charts, tables, and other visualizations, make use of the interface, which enables you to drag and drop items.
-
Choose the appropriate categories, fields, and filters to include in your report. To generate reports that are more relevant to your needs, you may, for instance, filter the data by employee, department, or date period.
-
Create customized calculations, pivot tables, and other types of sophisticated analytics with the help of built-in analytics and visualization tools.
-
You may set up the report so that it will run automatically on a certain schedule and then be emailed, transmitted via a mobile app, or shared through a web app with certain stakeholders.
-
In the event that more analysis is required, you have the option to export the report to Excel, PDF, CSV, or one of many other formats.
-
If you want to improve decision-making, you should discuss the report with the other members of the team, as well as any stakeholders and management.
If you utilize CloudApper to run sophisticated reports for UKG Pro, you will be able to gain a holistic picture of the performance of your company that is more thorough and accurate. In addition, you will be more prepared to make decisions based on your UKG data as a result.
Key Takeaways
- Streamlined Reporting: UKG Pro offers a straightforward process for generating standard and custom reports, enhancing decision-making with accurate data analysis.
- Custom Reporting: CloudApper’s integration with UKG Pro allows for advanced custom reports and BI dashboards, enabling users to filter data and visualize it according to specific business needs.
- Automation & Alerts: Reports can be scheduled to run automatically and include custom alerts, ensuring timely access to critical business insights.
- Data Export Options: Reports can be exported in various formats (Excel, PDF, CSV) for further analysis or integration with other systems.
Need assistance running a custom report or integrating CloudApper with your UKG solution? Our customer success specialists can assist you in achieving your objective if you contact us immediately.
FAQ
Q1: How does CloudApper enhance UKG Pro’s reporting capabilities?
A1: CloudApper enables the creation of highly customized reports and BI dashboards, allowing for advanced data filtering, visualization, and the addition of custom calculations. This integration provides a more comprehensive view of business performance compared to standard UKG Pro reports.
Q2: Can reports be automated in UKG Pro using CloudApper?
A2: Yes, CloudApper allows reports to be scheduled to run automatically, sending them to specific stakeholders via email, mobile apps, or web apps. This ensures timely access to essential data.
Q3: What types of data visualization can be added to custom reports?
A3: Users can add various visualizations, including charts, tables, and gauges, to their reports, helping to present data clearly and concisely. CloudApper also supports the creation of pivot tables and custom analytics.
Q4: How can CloudApper help in sharing and discussing reports?
A4: Reports generated through CloudApper can be shared with team members and management via multiple channels, including email and mobile apps. This facilitates discussion and collaborative decision-making based on accurate data insights.
*Disclaimer: Due to privacy reasons, the identity of the person or company cannot be revealed.


