Step-by-step guide on building custom reports for UKG to improve visibility, speed up decisions, and streamline HR operations.


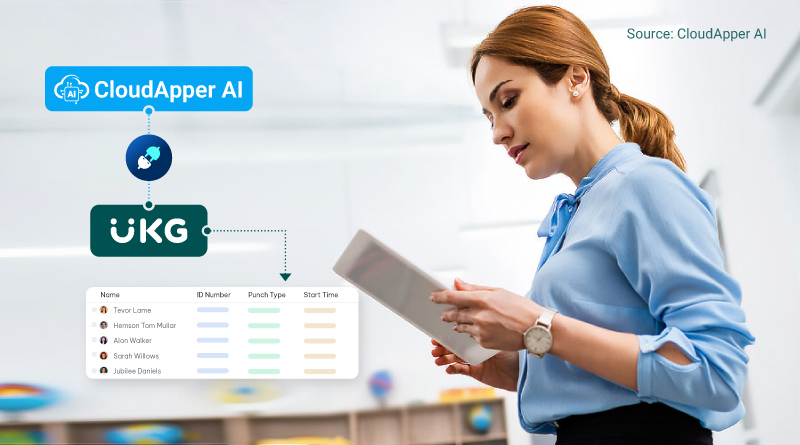
Table of Contents
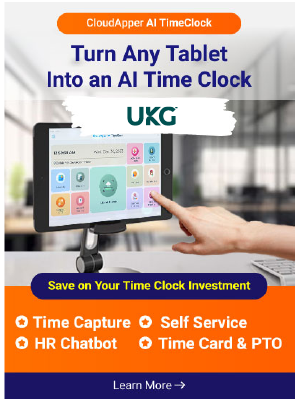
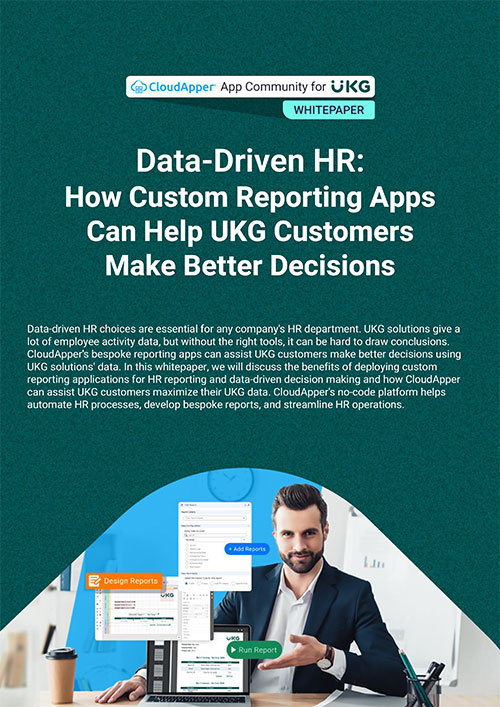
HR professionals rely on UKG as the foundation for workforce management—but when it comes to gaining deeper visibility, there’s an opportunity to do even more. With CloudApper, organizations can create custom reports for UKG that align perfectly with their unique operational goals, compliance requirements, and management structure—without waiting on IT or using third-party BI tools. By leveraging CloudApper, organizations can quickly scale their analytics approach with custom reports for UKG that evolve as their business grows. These reports ensure every department—from HR to operations—has access to insights that are both relevant and actionable.
This step-by-step guide walks you through how CloudApper can be used to build and manage custom reports that unlock real-time workforce insights—ensuring HR leaders have the information they need, when they need it. In practical terms, you’ll see how to move from “what happened last month?” to “what’s happening right now—and what should we do next?” Each step builds on familiar UKG concepts, so there’s no steep learning curve. The goal is to help you ship your first dashboard quickly, then iterate toward a full analytics workspace that empowers HR, operations, and finance. Along the way, we’ll highlight tips for governance, sharing, and adoption so your reporting becomes a repeatable, scalable capability—not a one-off project.
Step 1: Identify the Metrics That Matter
Before building custom dashboards, it’s important to define which KPIs or data points are most valuable for your team. Every organization is different, and CloudApper gives you the flexibility to focus on what truly matters. Start with a simple discovery session: list the decisions you need to make weekly or monthly, then map the metrics that support those decisions. For example, if you’re trying to reduce overtime, you may want a rolling 7-day view of hours worked vs. scheduled, broken down by job, site, and manager. If retention is the focus, track tenure bands, first-year attrition, and exit reasons side-by-side. CloudApper’s configurable data model lets you prioritize outcomes, not just fields—so your dashboards tell a story rather than dump raw numbers.

Examples of high-impact metrics include:
- Turnover trends by department or location
- Overtime hours and budget alignment
- Certification or training completion status
- PTO trends and employee availability
- Diversity and workforce composition insights
These metrics are all available within UKG—CloudApper simply brings them to life in a more interactive and tailored way. You can also stage “decision packages” that bundle related KPIs into one view—like a Staffing Health panel that combines real-time headcount insights, schedule adherence, absence hotspots, and open requisitions. Because the widgets are interactive, leaders can filter to a single region or job code and instantly see the downstream effects on service levels and labor cost. The result: faster meetings, cleaner escalations, and fewer ad-hoc report requests.
Step 2: Create a Role-Based Dashboard Structure
CloudApper allows you to configure dashboards that are aligned to different roles or departments. This ensures everyone—from HR executives to department heads—can access insights relevant to their responsibilities. Role design is the secret to adoption. CloudApper lets you define personas—Executives, HR Business Partners, Plant Managers, Store Leaders, or Scheduling Coordinators—and pre-load each persona with the exact widgets they need. That means fewer clicks, less training, and more consistent decision-making. You can even standardize definitions (e.g., “overtime risk” = >8% of scheduled hours) so every team references the same thresholds across locations.
Here’s how to structure it:
- Executive dashboards: High-level trends and forecasting
- HR team views: Compliance tracking, hiring funnels, engagement metrics
- Department dashboards: Staff performance, headcount, and time-off data
This role-specific customization ensures clarity without clutter. As your organization evolves, add specialized views—like Safety & Training for regulated industries, or Agency Spend for contingent labor. Because CloudApper inherits UKG security, a district manager will only see their stores, while a CHRO can roll up nationwide results. Many customers also pin a compact real-time headcount insights tile to every persona so staffing gaps are visible at a glance.

Step 3: Design Visual Dashboards With Real-Time Sync
Now that your structure is set, use CloudApper’s intuitive tools to build out dashboards with charts, graphs, gauges, and filters. These dashboards update automatically by connecting with your UKG environment. Visual hierarchy matters: lead with a few “north-star” KPIs at the top, follow with trend charts, then finish with diagnostic tables that explain the why. CloudApper’s drag-and-drop editor makes it easy to arrange components and apply consistent labeling and units. Because the connection stays live, you can monitor shift start adherence, call-ins, and approvals as they occur—no manual refresh needed.
Popular visualization types include:
- Bar graphs for attrition or hiring trends
- Pie charts for diversity breakdowns
- Line charts for overtime tracking
- KPI scorecards for goal monitoring
Visualizing the data makes it easier for decision-makers to take action quickly. Add smart filters—date ranges, locations, jobs, and cost centers—so users can answer their own follow-up questions without exporting to Excel. Conditional formatting can flag thresholds (e.g., turn a card red when unapproved overtime exceeds a target), prompting proactive outreach. For field teams, compact mobile views ensure the same insights are available on tablets at the punch screen or on a manager’s device during a floor walk.
Step 4: Integrate Custom Fields for Deeper Insights
Many organizations capture data beyond standard fields—such as project assignments, job site locations, or skill ratings. CloudApper makes it simple to pull those custom fields into your custom reports for UKG, adding another layer of insight.
You can:
- Add new field types on the fly
- Filter dashboards using custom data
- Generate department-level comparisons using unique metrics
This brings more context to workforce data and supports better analysis. The flexibility of custom reports for UKG within CloudApper makes it possible to combine operational data with workforce insights, giving leaders a complete view of performance drivers in real time.
Step 5: Set Permissions and Share Securely
CloudApper supports secure sharing with role-based access. You control who sees what, ensuring that sensitive data remains protected while still empowering department leaders and executives with relevant insights. Security should never slow down speed. CloudApper respects your UKG roles and expands them with granular object- and field-level controls—so an HRBP can see comp bands while a store manager cannot. Dashboards can be shared as view-only links, scheduled email snapshots, or embedded directly within your UKG workflows to keep users in one system of engagement. Audit trails provide a record of who accessed which report and when, supporting enterprise compliance.
You can:
- Assign permissions by role, region, or team
- Share dashboards via links or embed into UKG workflows
- Restrict access to sensitive fields as needed
Everything is fully aligned with enterprise security best practices. For external stakeholders—like BPO partners or consulting teams—you can grant time-boxed access with masked identifiers. And when reorganizations happen, CloudApper’s bulk role updates make it simple to keep access aligned with your org structure without rebuilding dashboards from scratch.
Step 6: Review and Iterate Over Time
Once your dashboards are live, your HR team can continue to refine and expand them. Add new widgets, track new KPIs, or reconfigure views based on evolving needs. There’s no need to start over or request outside help—everything can be updated directly within the platform. Establish a monthly “insights review” ritual: document what changed, what actions were taken, and what results followed. Use these notes to adjust targets, add diagnostic views, or retire metrics that no longer serve decisions. CloudApper’s versioning lets you experiment safely—clone a dashboard, test a new layout with a pilot group, and then promote it organization-wide once validated. Over time, you’ll build a balanced scorecard that connects people metrics to operational and financial outcomes.
This continuous improvement ensures your custom reports for UKG stay relevant as your workforce strategy evolves. As your analytics maturity grows, you can layer in forecasting and alerting—like predicting overtime risk based on schedule fills and absence patterns, or notifying HR when a location’s voluntary turnover trends above seasonal norms. The destination is a self-service analytics culture where frontline leaders trust the numbers and act fast, while HQ benefits from consistent, comparable reporting across every site.

FAQs
1) How to create custom reports in Kronos?
If your organization refers to UKG Pro WFM (formerly Kronos), CloudApper lets you connect to your UKG data and compose reports visually—no complex queries required. Start by selecting your data sets (time, scheduling, accruals, etc.), then drag-and-drop widgets (tables, charts, KPIs). Apply filters for location, job, and date ranges, and save the layout as a reusable dashboard. You can embed it back into UKG workflows, schedule snapshots, or share secure links with role-based access.
2) What’s the fastest way to get real-time headcount insights for today’s shifts?
Pin a Headcount card to your manager dashboard and filter by site, department, and shift window. Because CloudApper stays in sync with UKG, the card updates as punches, call-ins, and approvals occur—so supervisors always know if coverage matches demand.
3) Can I include custom fields like skill level or project code in my reports?
Yes. Map any custom fields you track—skills, client, project, pay code—then add them to filters, tables, and alerts. This lets you see not only how many people are scheduled, but whether the right mix of certified talent is present.
4) How do we keep sensitive data secure while sharing dashboards broadly?
CloudApper honors UKG permissions and adds fine-grained controls at the dashboard and field level. Share view-only links, mask identifiers where needed, and rely on audit logs for compliance. Access can be scoped by role, region, or team.
5) What does a good rollout plan look like for HR analytics?
Begin with a pilot group and a narrow use case (e.g., overtime reduction). Build a role-based dashboard, train users with short video walkthroughs, and set clear targets. After four weeks, review outcomes, refine the layout, and scale to additional sites or teams. Keep a monthly cadence of insights reviews to maintain momentum.
Consult our experts today to see how easy it is to build custom reports for UKG with CloudApper—and start accessing real-time workforce insights that drive better decision-making.